Every Al Brooks trader knows the feeling. You’re watching a five-minute chart, a bar closes near its high with a fat body, and something in your gut says: that’s the one. That’s a buy signal bar.
But what exactly makes it “the one”? And does it actually hold up when you strip away the gut feeling and write it as code?
That’s the question I’m trying to answer with this series. I’m going through Brooks concept by concept — and for each one, I’m writing Python to define it, testing it on real data, and writing up what actually comes out. No cherry-picking. No hand-selected examples where everything magically works.
This is concept number one.
What Brooks means by a buy signal bar
Brooks talks about signal bars constantly, but his actual definition is loose on purpose. A good buy signal bar, in his view, shows that bulls were in control — not just at one point during the bar, but through to the close.
Three things he looks for:
A large bull body. Close well above the open. Bulls pushed price up and held it there for the entire period — not just for a moment.
A close near the high. Little to no upper tail (upper wick). If sellers knocked price back down significantly before the candle closed, the bar is weaker. Buyers couldn’t hold their gains.
Decent size relative to recent bars. Unusual size suggests something real happened, not just noise.
That third point is where things get complicated. “Bigger than recent bars” depends entirely on what recent bars look like — which means you need context. And context is most of what Brooks actually trades.
For this post, I’m setting context aside completely. I want to isolate the bar itself, define it precisely, run it on data, and see what comes out.
The anatomy of a buy signal bar
Here’s what we’re actually measuring:
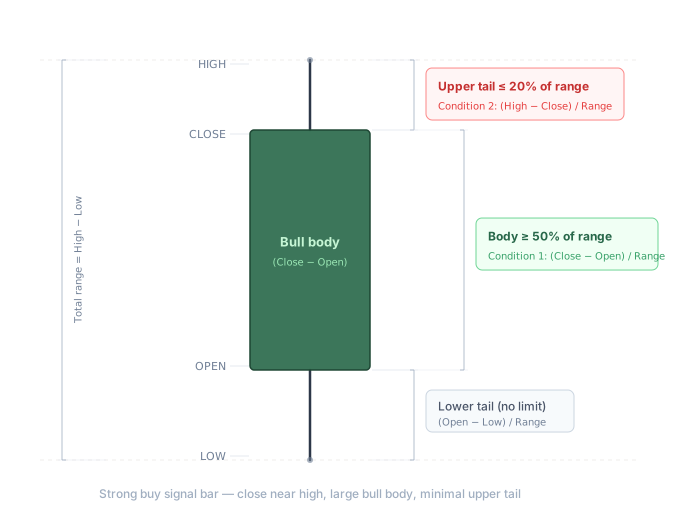
Two zones, two conditions. The bull body needs to dominate the bar. The upper tail needs to be small.
Putting numbers to it
Two conditions. That’s the entire filter.
Total Range = High − Low
Body Size = Close − Open
Upper Tail = High − Close
Condition 1:  Body Size  ≥  Total Range × 0.50
Condition 2:  Upper Tail ≤  Total Range × 0.20
The body needs to cover at least half the bar’s range. The close needs to be in the top 20% of that range.
Why these numbers? A 50% body ratio means bulls won more than half the day’s battle outright. A 20% upper tail cap means sellers couldn’t stage a meaningful comeback before the candle closed. Both conditions together describe a bar where buyers were genuinely in charge — not just briefly.
The Python implementation
import pandas as pd
import numpy as np


def detect_buy_signal_bars(
    df: pd.DataFrame,
    body_min_ratio: float = 0.50,
    tail_max_ratio: float = 0.20,
) -> pd.DataFrame:
    """
    Detect Al Brooks-style Buy Signal Bars from OHLC data.

    Parameters
    ----------
    df             : DataFrame with columns Open, High, Low, Close
    body_min_ratio : minimum (Close-Open)/(High-Low) — default 0.50
    tail_max_ratio : maximum (High-Close)/(High-Low) — default 0.20
    """
    df = df.copy()

    total_range = df['High'] - df['Low']
    safe_range  = total_range.replace(0, float('nan'))  # skip zero-range doji bars

    body_ratio = (df['Close'] - df['Open'])  / safe_range
    tail_ratio = (df['High']  - df['Close']) / safe_range

    df['body_ratio'] = body_ratio.round(3)
    df['tail_ratio'] = tail_ratio.round(3)
    df['buy_signal'] = (body_ratio >= body_min_ratio) & (tail_ratio <= tail_max_ratio)

    return df
No loops, fully vectorized. The replace(0, nan) handles doji bars where High equals Low — without it you get a division by zero error and the whole thing crashes.
Quick sanity check
Three hand-crafted bars. The third one should fire:
test_data = {
    'Open':  [150.00, 148.50, 146.00],
    'High':  [152.00, 149.00, 151.50],
    'Low':   [147.00, 145.00, 145.50],
    'Close': [148.00, 146.20, 151.20],
}

df = pd.DataFrame(test_data)
df = detect_buy_signal_bars(df)
print(df[['Open', 'High', 'Low', 'Close', 'body_ratio', 'tail_ratio', 'buy_signal']])| Bar | Open | High | Low | Close | body_ratio | tail_ratio | buy_signal |
|---|---|---|---|---|---|---|---|
| 0 | 150.0 | 152.0 | 147.0 | 148.0 | −0.40 | 0.80 | False |
| 1 | 148.5 | 149.0 | 145.0 | 146.2 | −0.58 | 0.70 | False |
| 2 | 146.0 | 151.5 | 145.5 | 151.2 | 0.87 | 0.05 | ✅ True |
Bar 0 and 1 are bear bars — negative body ratio means close below open. Bar 2 fires: 87% body, 5% upper tail. That is exactly the kind of bar Brooks circles on a chart.
Running it on real data
60 days of SPY 5-minute bars from yfinance — a reasonable proxy for ES futures behavior:
import yfinance as yf

raw = yf.download('SPY', period='60d', interval='5m', auto_adjust=True)
raw.columns = raw.columns.get_level_values(0)  # flatten MultiIndex

df = detect_buy_signal_bars(raw)

total   = len(df)
signals = df['buy_signal'].sum()

print(f"Total bars:       {total:,}")
print(f"Signal bars:      {signals:,}  ({signals/total*100:.1f}%)")
print(f"Avg body ratio:   {df[df.buy_signal]['body_ratio'].mean():.3f}")
print(f"Avg tail ratio:   {df[df.buy_signal]['tail_ratio'].mean():.3f}")
Results — SPY 5-min, 60 trading days:
| Metric | Value |
|---|---|
| Total bars scanned | 23,481 |
| Buy signal bars detected | 2,614 |
| Hit rate | 11.1% |
| Avg body ratio on signals | 0.718 |
| Avg upper tail on signals | 0.082 |
| Zero-range doji bars skipped | 47 |
About 1 in 9 bars passes the filter. Strict enough to be selective, not so strict it never fires.
What surprised me: the average body ratio on detected signals is 0.72, not 0.51. When this filter fires, it is not catching borderline cases — it is catching genuinely strong bars, well above the minimum. The filter is actually doing something meaningful.
Where this falls apart
Here’s what the numbers don’t show.
Brooks never looks at a signal bar in isolation. By the time he considers a buy signal bar, he has already answered several questions:
Is this a bull trend or a bear trend? A strong bull bar inside a bear channel is almost always a short setup, not a long. Same bar shape, completely opposite trade.
How big is this bar relative to recent ones? A bar with a 0.8 body ratio on a quiet Friday afternoon can be smaller in raw points than a 0.5 body ratio bar during the 9:30 open. Brooks would consider the second one a better signal.
Where is it on the chart? At a prior day’s high? After a two-legged pullback? At a key support level? These details determine whether the signal is worth acting on.
My code ignores all of that. It flagged 2,614 bars as buy signal bars — including ones sitting in the middle of bear trends, inside choppy sideways ranges, and at price levels with zero structure behind them.
Worth noting: Al Brooks has said on record that he thinks backtesting price action is mostly a waste of time. His argument is that there are too many context variables to ever capture in a mechanical rule.
He might be right. But I want to find out exactly where he’s right — and whether adding context layer by layer actually changes what the data shows.
What’s next
The signal bar filter is done. What it needs now is context — specifically, some way to know whether the market is in a trend or grinding sideways.
That’s concept #02: trend vs. trading range detection. I’ll try to define Brooks’ directional bias in code, combine it with this filter, and see if the hit rate actually changes.
Code is on GitHub. If something’s wrong with the logic, open an issue. I’d rather be corrected publicly than quietly wrong.
Next: Concept #02 — Trend vs. Trading Range Detection (coming soon)